There are two options for extending and customising Fenwick Gold for Power BI.
We recommend building new reports where possible to go alongside the included reports. A Dashboard can be used to consolidate visuals from multiple reports onto a single page.
Build a new report from the Fenwick Gold Semantic Model
You can build a new report with full control over the visualisations using the following steps.
- Navigate to the Fenwick Gold App
- From the App hover the ellipsis then select Edit.
- From the Semantic Model hover the ellipsis and select Create Report.
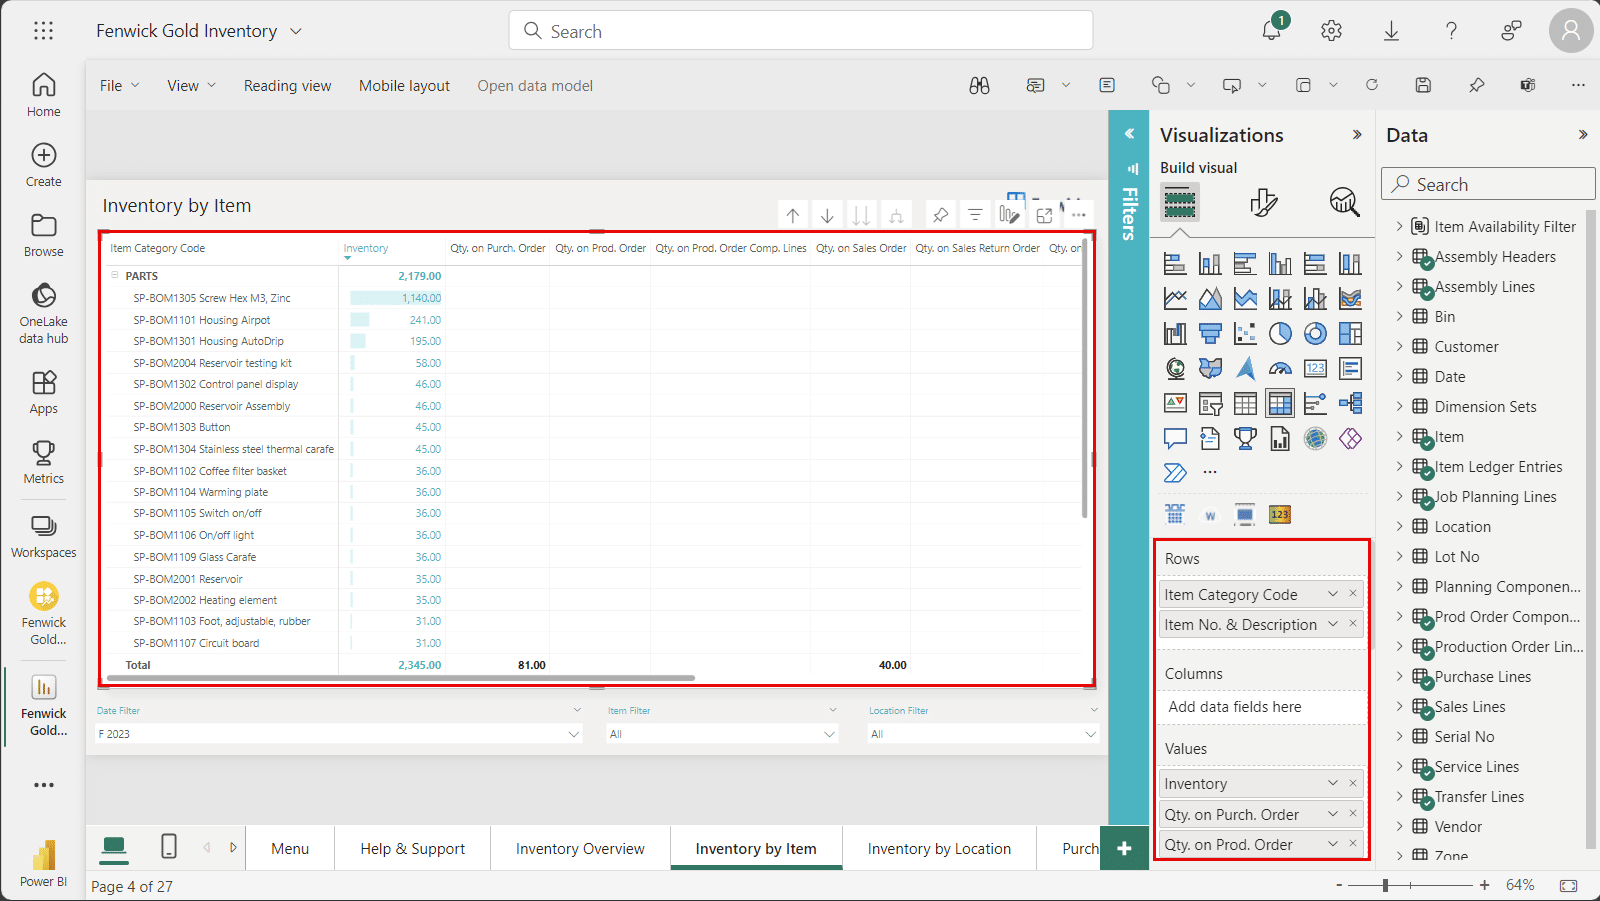
- You will then be taken to the Power BI report builder. Down the right-hand side of your screen you will see the Visualisations Pane and the Fields Pane.This is where you will be able to utilise the Fenwick Gold measures (denoted by a calculator symbol) and the Fenwick Gold fields with the suite of visuals available in the report builder.
Editing an included report
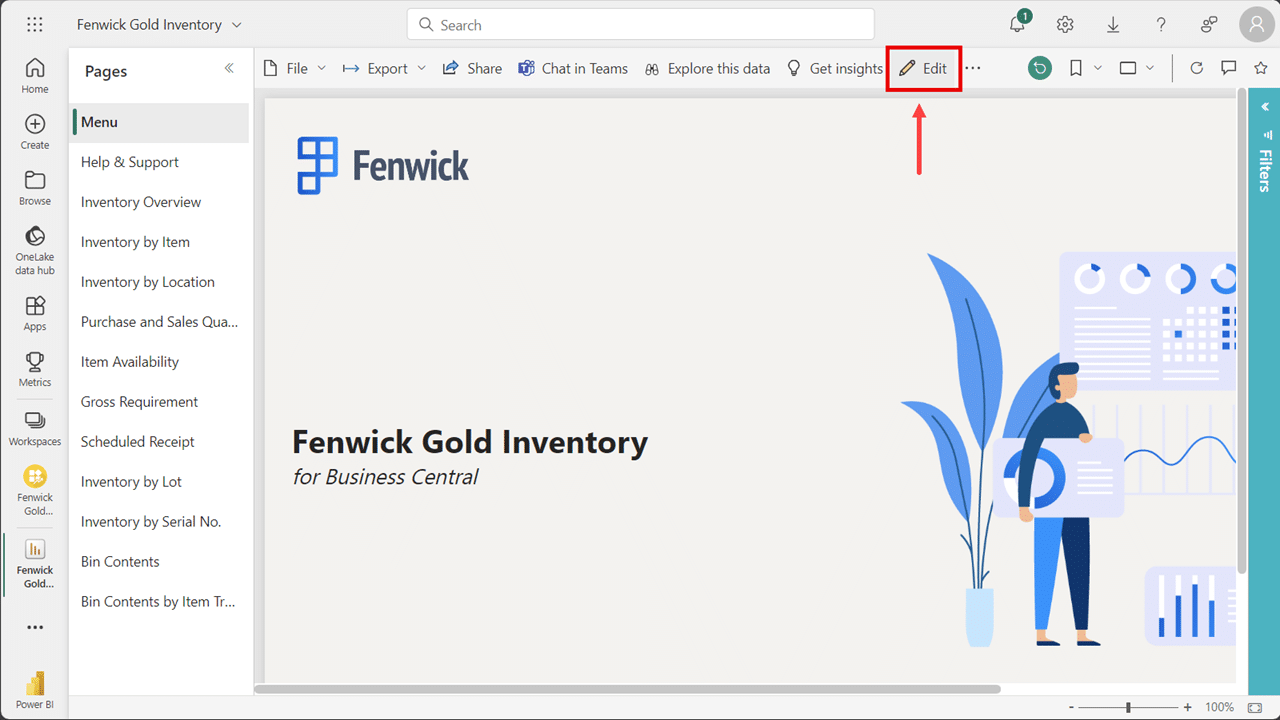
While viewing the standard Fenwick Gold report you can enable Edit Mode using the Edit option on a report page. This allows you to make changes to the visualisations.
Whilst in Edit Mode you can click on a visual and see which fields and measures are used via the Visualisations Pane.