Building on the success of last year’s embedded Power BI reports, Microsoft continues to strengthen reporting capabilities within Dynamics 365 Business Central. The 26.1 release of Dynamics 365 Business Central introduces a new sustainability module, reflecting the growing need for businesses to track and report on environmental impact. To support this, Microsoft has released a dedicated report pack designed to surface key sustainability metrics directly within Business Central.
Expanding on the embedded reporting functionality in the previous release, this new pack adds ten reports focused specifically on sustainability data. Each report serves a different purpose, offering insights across various aspects of environmental performance. In this article, we’ll take a closer look at five of the reports.
The Overview Report
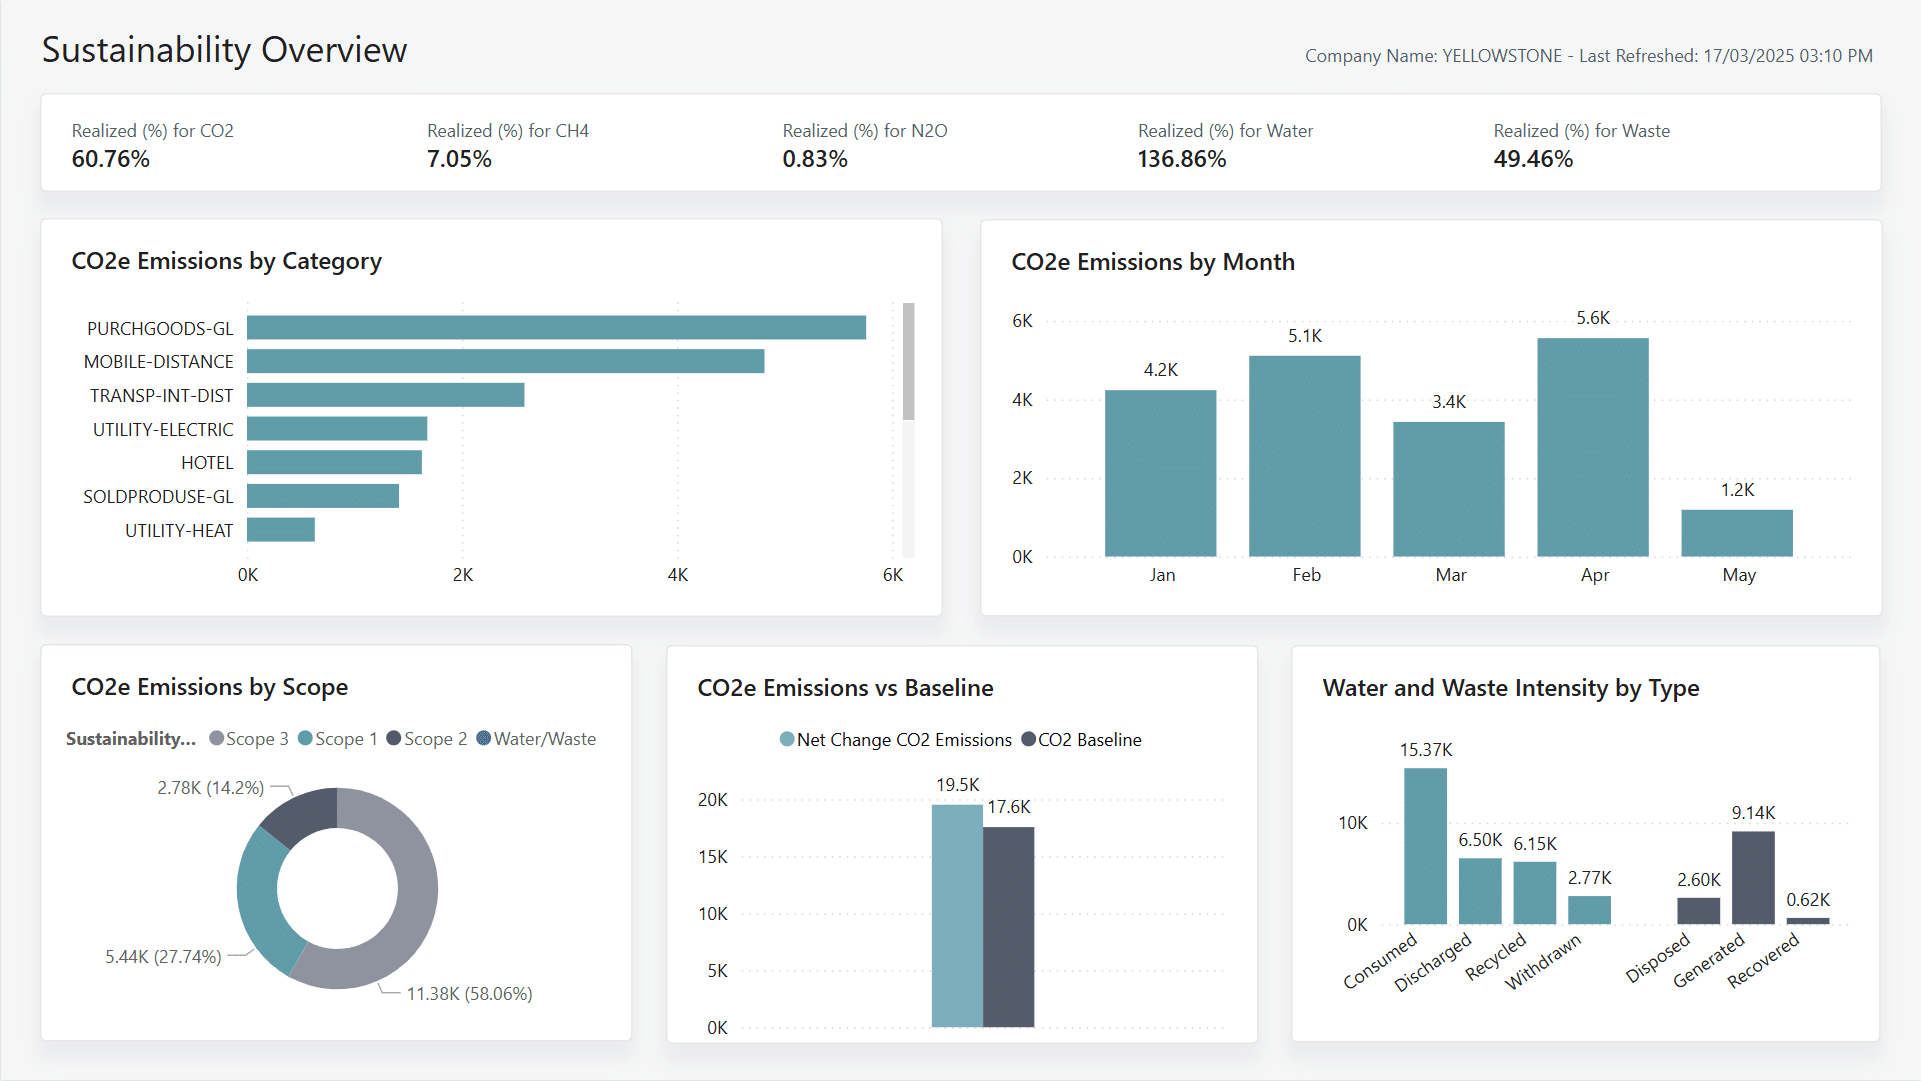
While it’s not one of the five reports we’ll be focusing on, the Sustainability Overview is worth mentioning. It provides a high-level summary of key data points covered in the detailed reports and can be a useful tool for gaining quick insights at a glance.
1. Journey to Net Zero Carbon
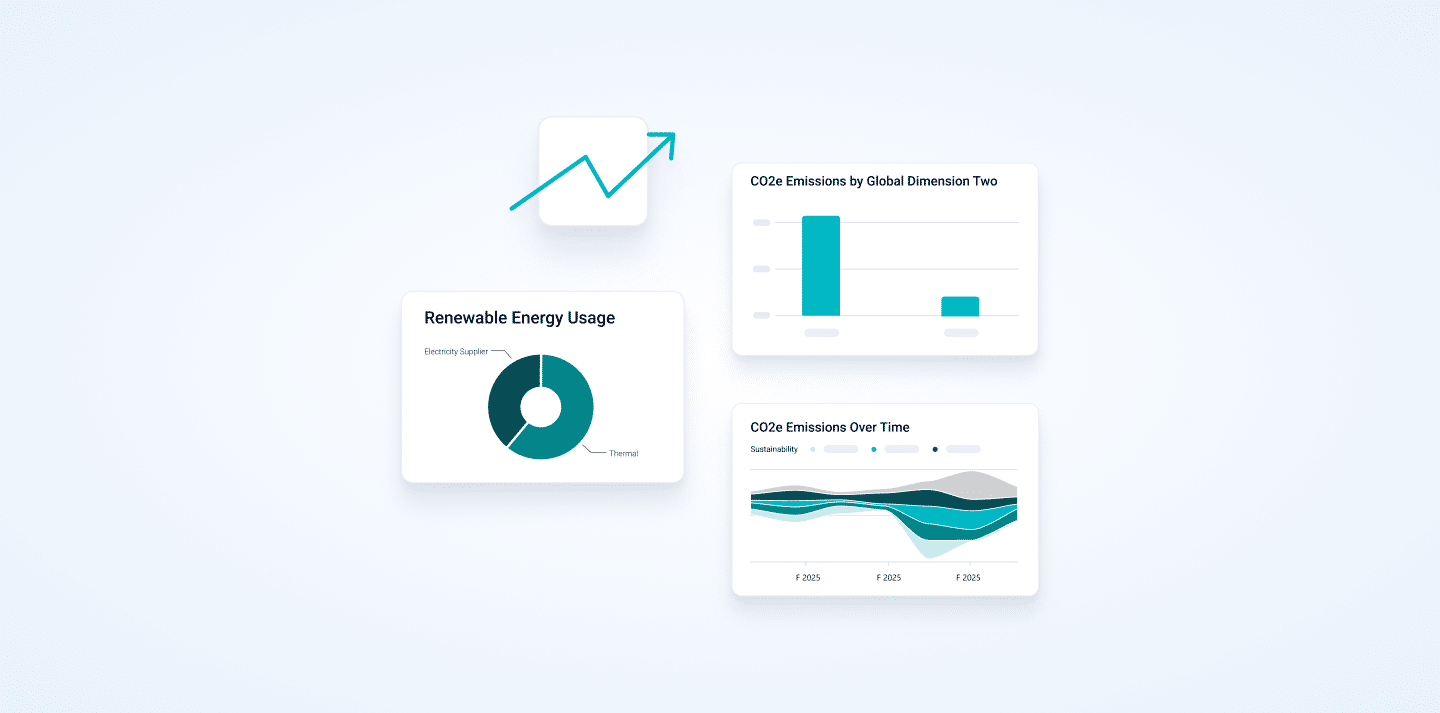
One of the standout reports in the Sustainability pack is the Journey to Net-Zero Carbon report, which we’ll explore in more detail. It presents key figures essential for ESG reporting and provides a clear view of an organisation’s progress toward net zero. Positioned at the top, it highlights critical KPIs such as CO₂e impact and offsets, offering an at-a-glance summary of the overall net carbon position. This visibility helps stakeholders quickly understand how current operations align with broader sustainability goals.
Being able to see these key figures in a central, accessible format makes it easier for organisations to track their emissions over time, identify areas where improvements can be made, and demonstrate accountability to investors, regulators, and internal teams. It also supports more informed decision-making when planning future sustainability initiatives.
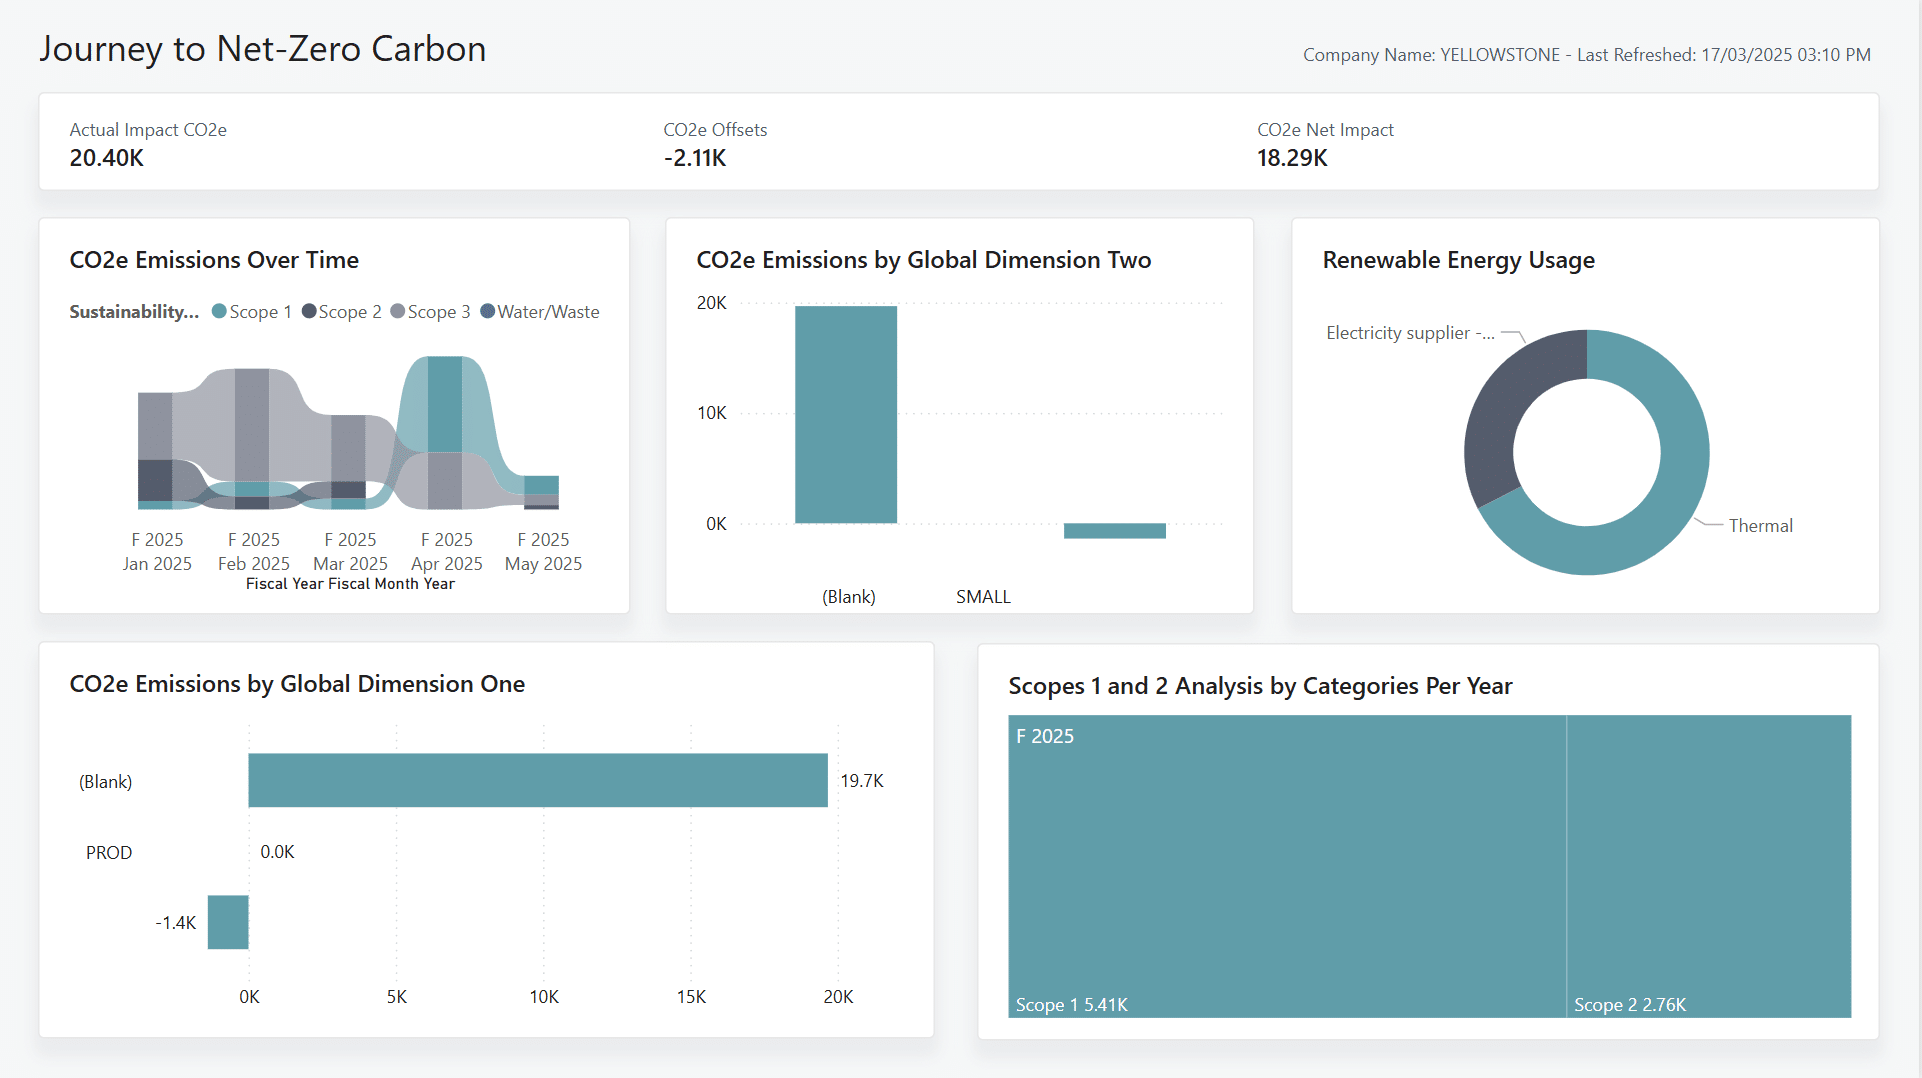
A notable strength of this report is that it’s one of the few out-of-the-box options that includes reporting across dimensions, emission scopes, and renewable energy usage. This enables a more granular view of where emissions are coming from, how they’re being managed, and how renewable energy sources are contributing to the organisation’s overall carbon footprint—without the need for extensive custom development.
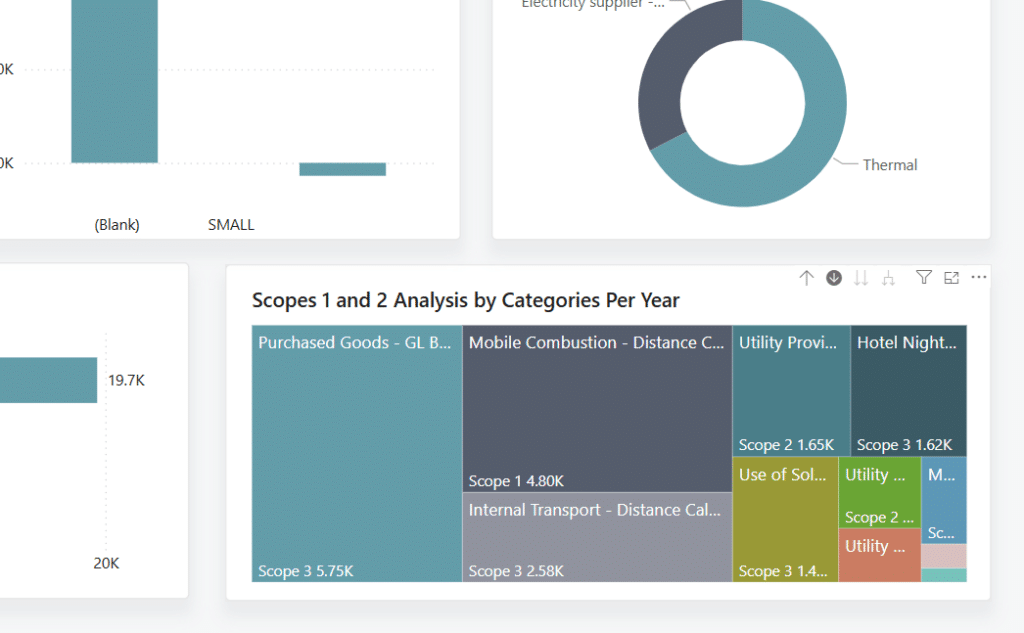
One of the key features of the report is its use of a variety of visual elements to present information in a more accessible way. For example, the Scope 1 and 2 Analysis by Categories Per Year offers a clear breakdown of emissions over time. The report begins with an overview of insights, then allows users to drill down into specific scopes and years to explore the data in more detail, supporting a deeper understanding of where emissions are occurring and how they change year-on-year.
2. Realized Emissions vs Target
The Realised Emissions vs Target report allows you to compare your actual emissions data against the targets you’ve defined in your emissions scorecards. These scorecards effectively act as emissions budgets, enabling you to set clear targets for various gas types. Using these values, the report shows how your organisation is performing against its emissions targets, making it easier to monitor progress and stay accountable.
At a glance, the top level of the report highlights your realised emissions, comparing them directly against the target values set in the scorecard. This is broken down by each key gas type, helping you identify where you are performing well and where further attention may be needed.
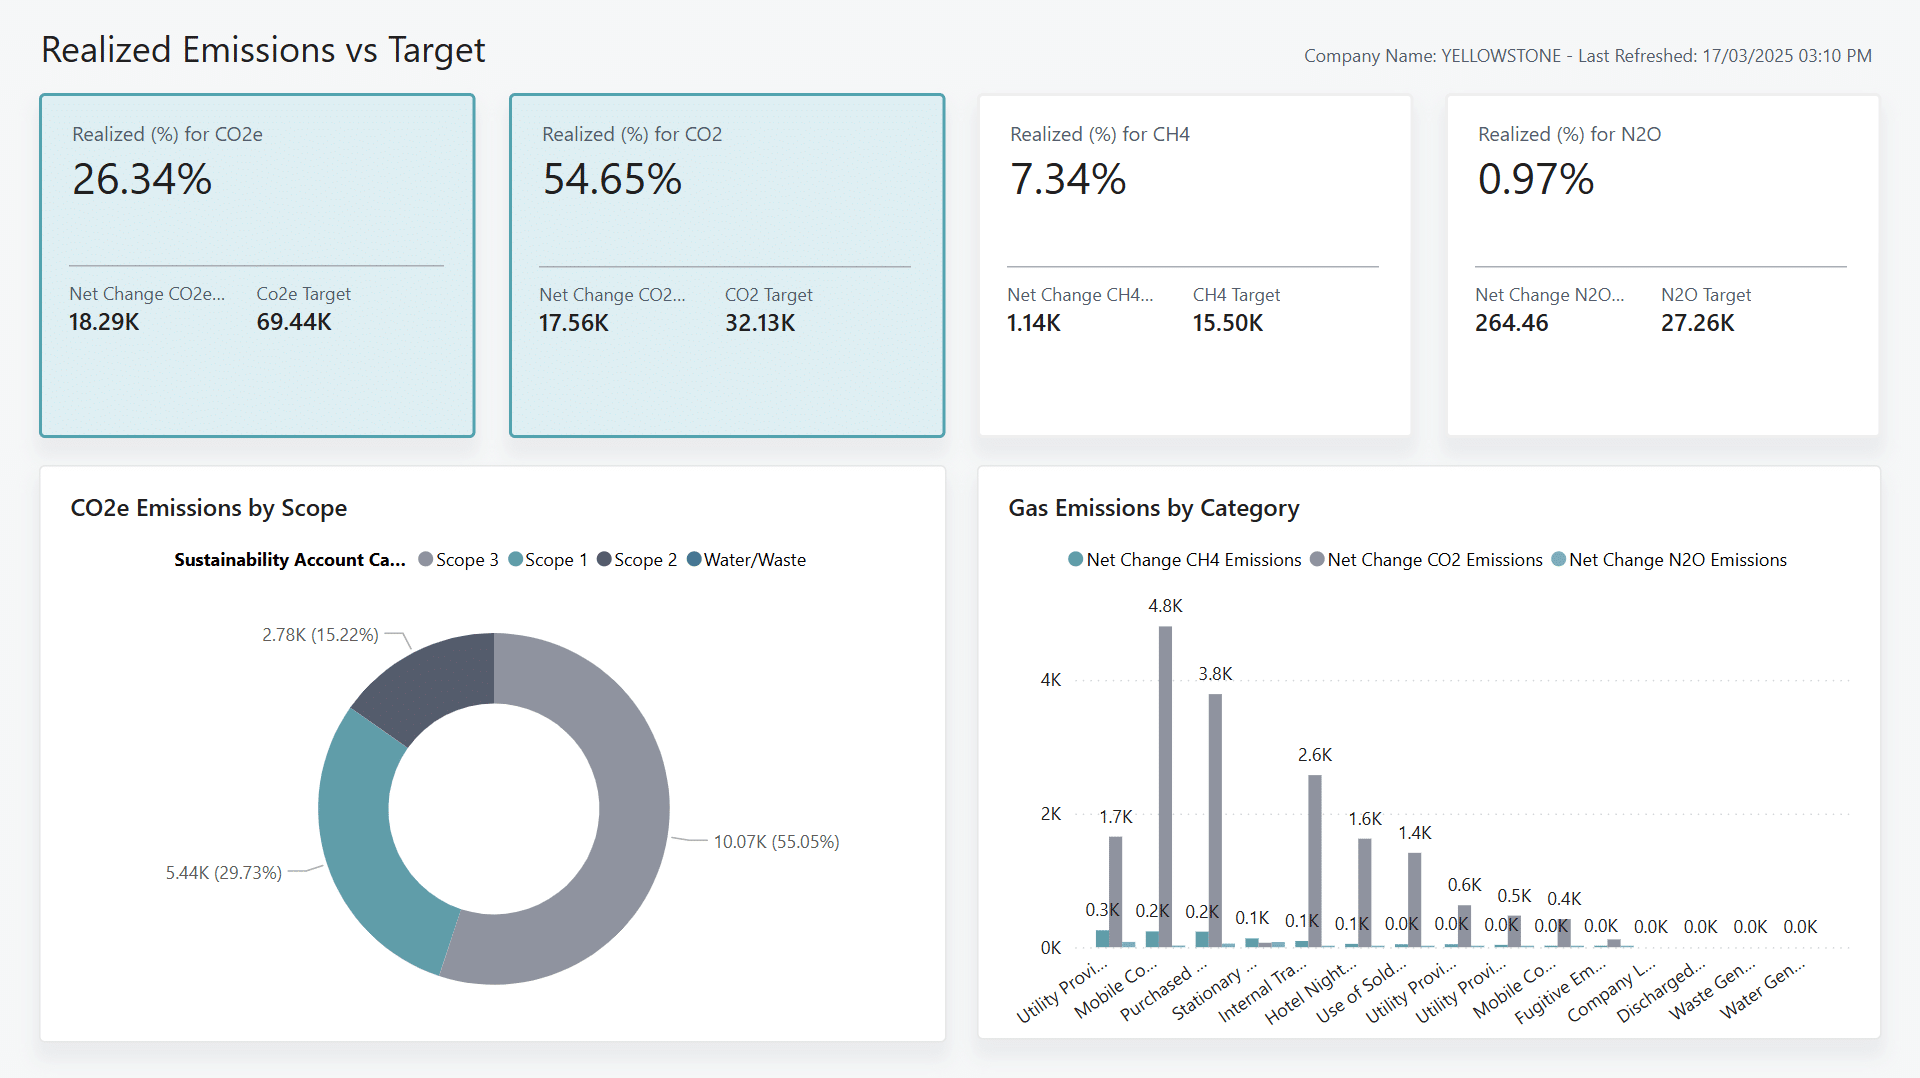
This report works in a similar way to another in the report pack, the Realised Emissions vs Baseline report. Both draw from the emissions scorecards to generate comparisons, one against a defined target, and the other against a baseline. The baseline is typically based on a predefined reference date, serving as a benchmark to assess your progress over time. These reports work together to provide you with a well-rounded view of current performance, historical trends, and progress toward long-term emissions goals.
3. Water and Waste Analysis
As the name suggests, the Water and Waste Analysis focuses on the environmental impact of water usage and waste management within the Sustainability module. It provides a detailed view across your organisation’s facilities (referred to as Responsibility Centres in Business Central), helping you monitor each location’s water capacity and the available space for additional usage.
The report also draws on the KPI targets defined in your sustainability scorecards for both water and waste. By aligning with these targets, it allows you to see whether each facility is operating within acceptable thresholds, meeting reduction goals, or exceeding baseline expectations. Whether you’re tracking against a set target or comparing performance to a baseline, the report makes it easier to stay aligned with your organisation’s environmental objectives.
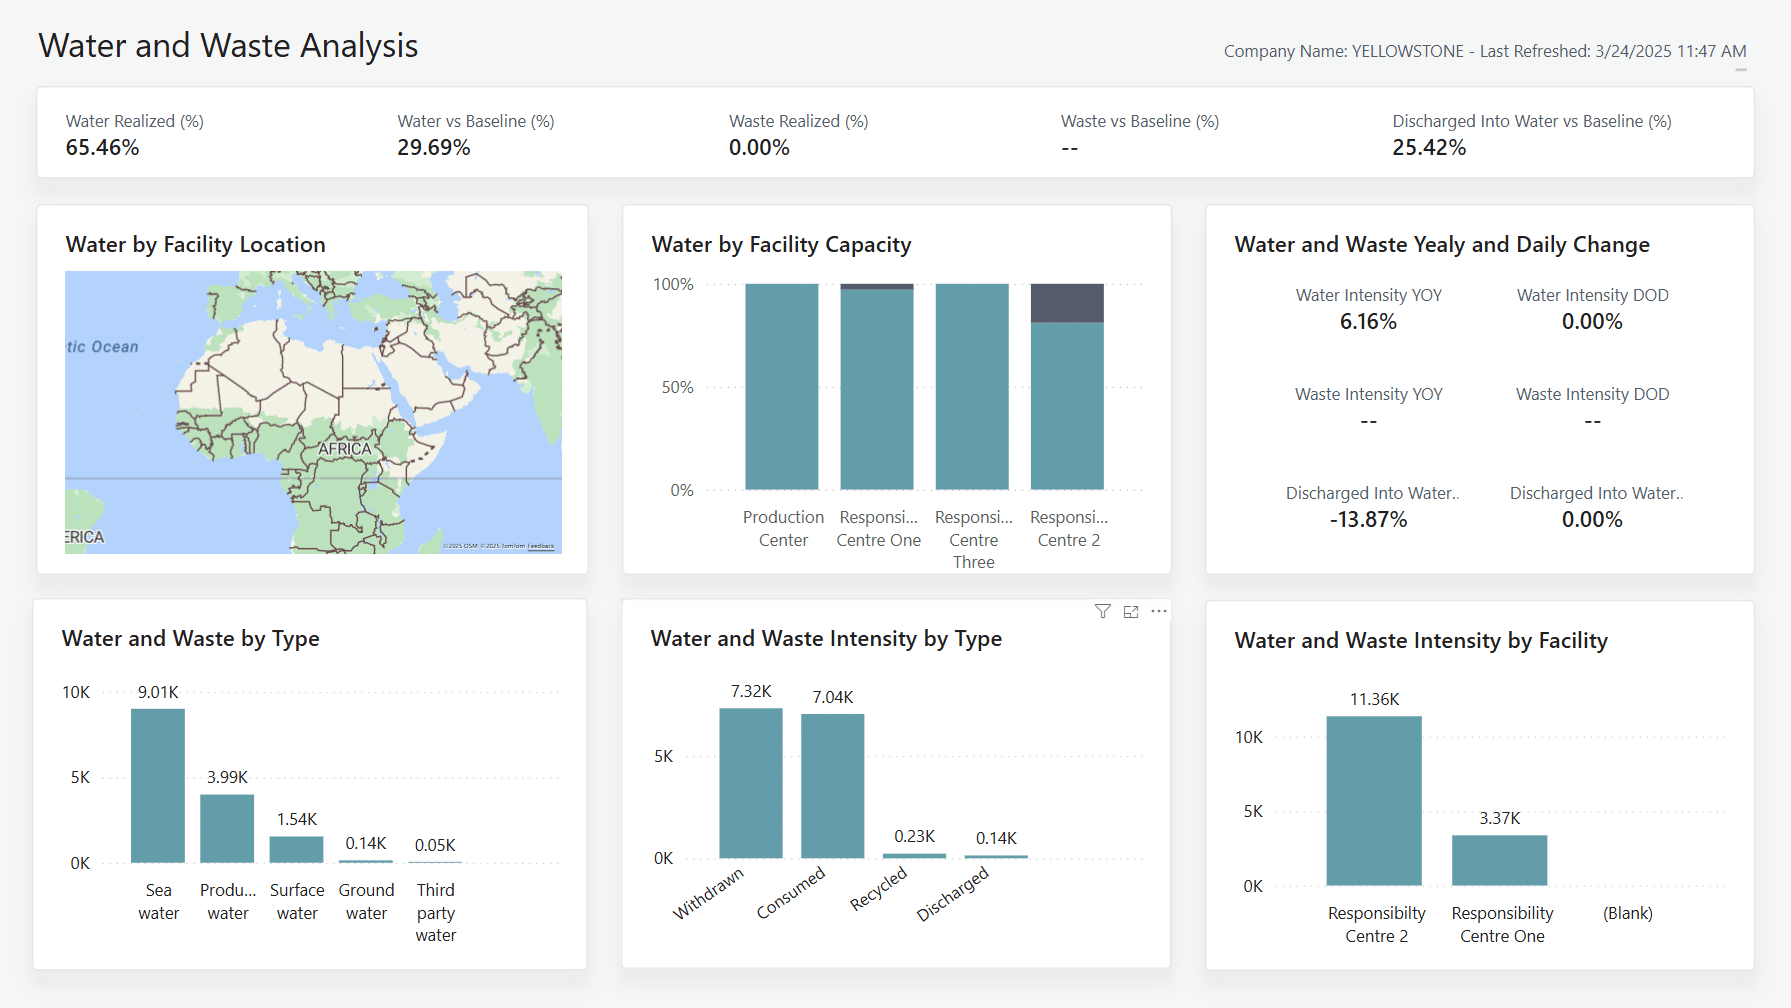
This level of visibility makes it easier to identify facilities that may need improvement or are performing above expectations. By presenting data clearly and in line with your defined targets or baselines, the report supports ongoing efforts to manage water and waste more effectively across your business.
4. CO2e Key Influences
As part of the broader move into AI-powered reporting, this report pack introduces a new AI visual feature: the Key Influencers report. The report uses machine learning to analyse your CO₂e emissions and identify which factors are most strongly influencing changes in those emissions, whether increasing or decreasing, across your dataset.
The report evaluates a range of variables, such as emission sources, operational activities, or locations, and determines which of these are contributing the most to your overall emissions trends. This helps uncover patterns and relationships that might not be immediately obvious through traditional reporting.
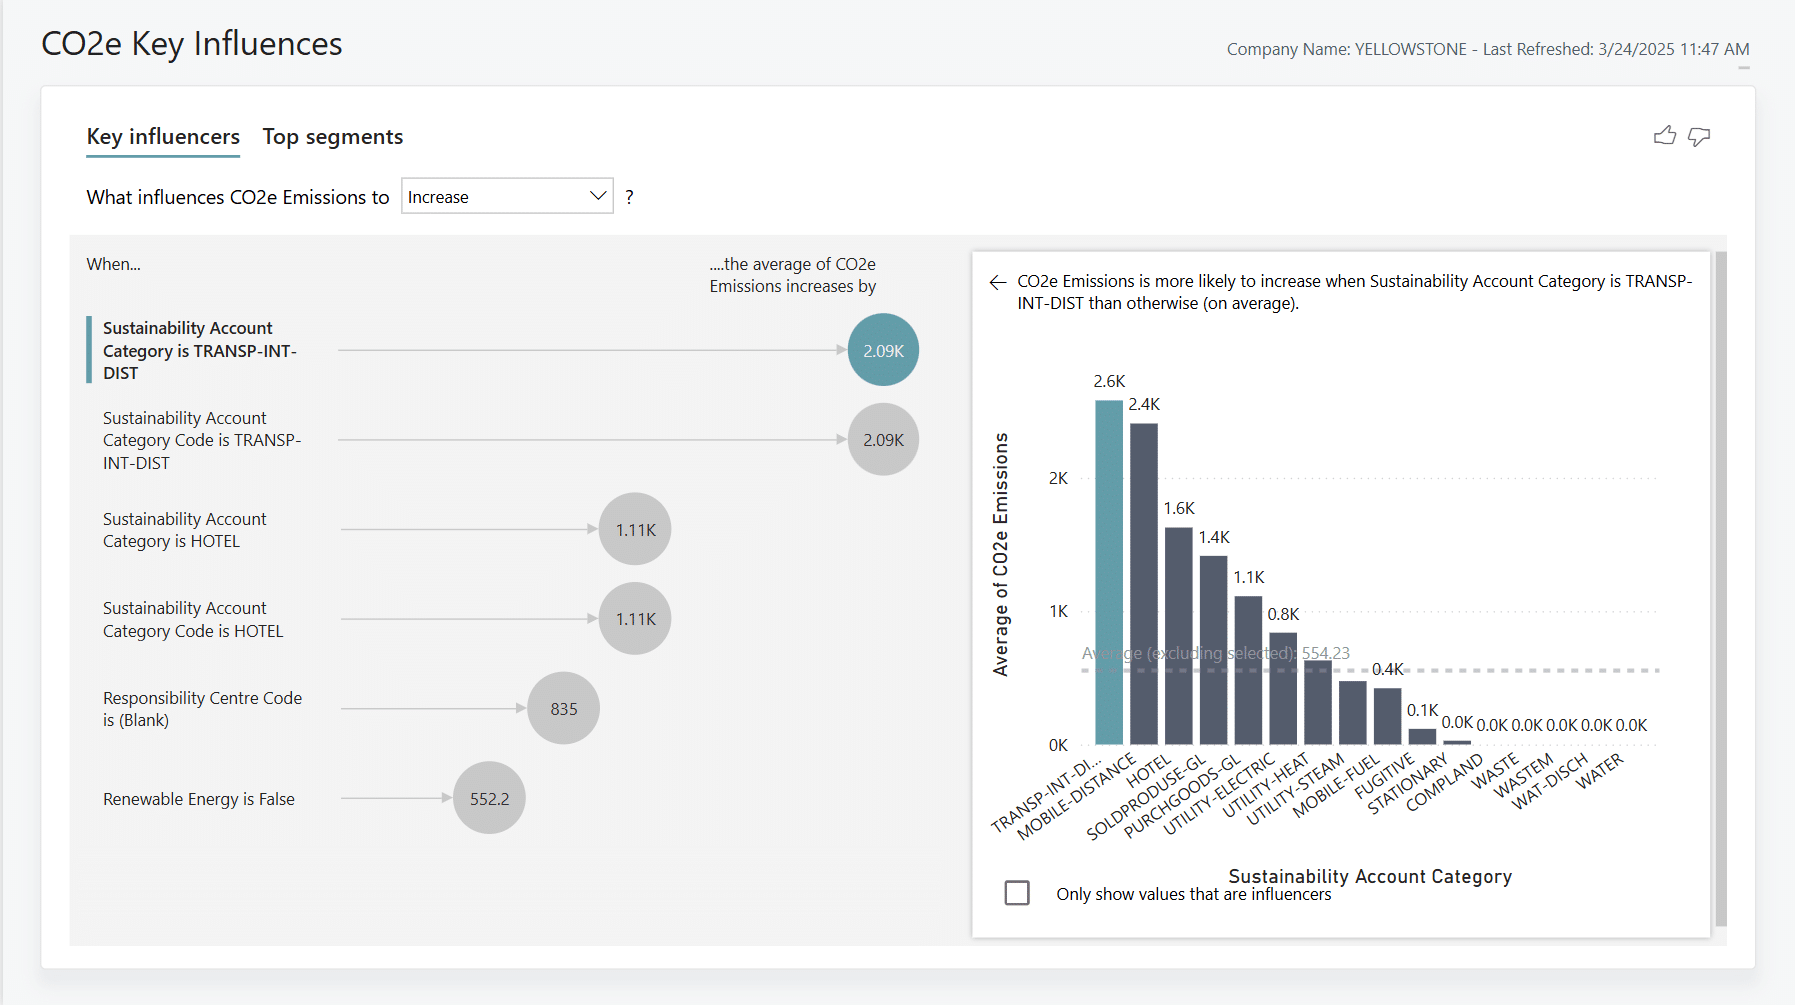
By highlighting the key drivers behind your emissions performance, the Key Influencers visual supports more informed decision-making. Whether you’re aiming to reduce emissions or understand why certain areas are exceeding targets, leveraging AI-driven can offer you a valuable perspective for shaping your sustainability strategy.
5. Social Analysis
While slightly outside the core Sustainability module, the Social Analysis report taps into long-standing capabilities within Business Central to support the Social Governance aspect of ESG reporting. Rather than focusing on environmental metrics, this report shifts attention to your organisation’s people, providing visibility into key workforce data that contributes to broader ESG accountability.
The report highlights important KPIs that are commonly required for social reporting, including metrics related to diversity, equity, and workforce composition. It provides breakdowns by gender and age, helping organisations assess demographic trends across their workforce. Additionally, it can report on employee qualifications and union affiliations, where relevant, offering a more comprehensive view of workforce structure and compliance.
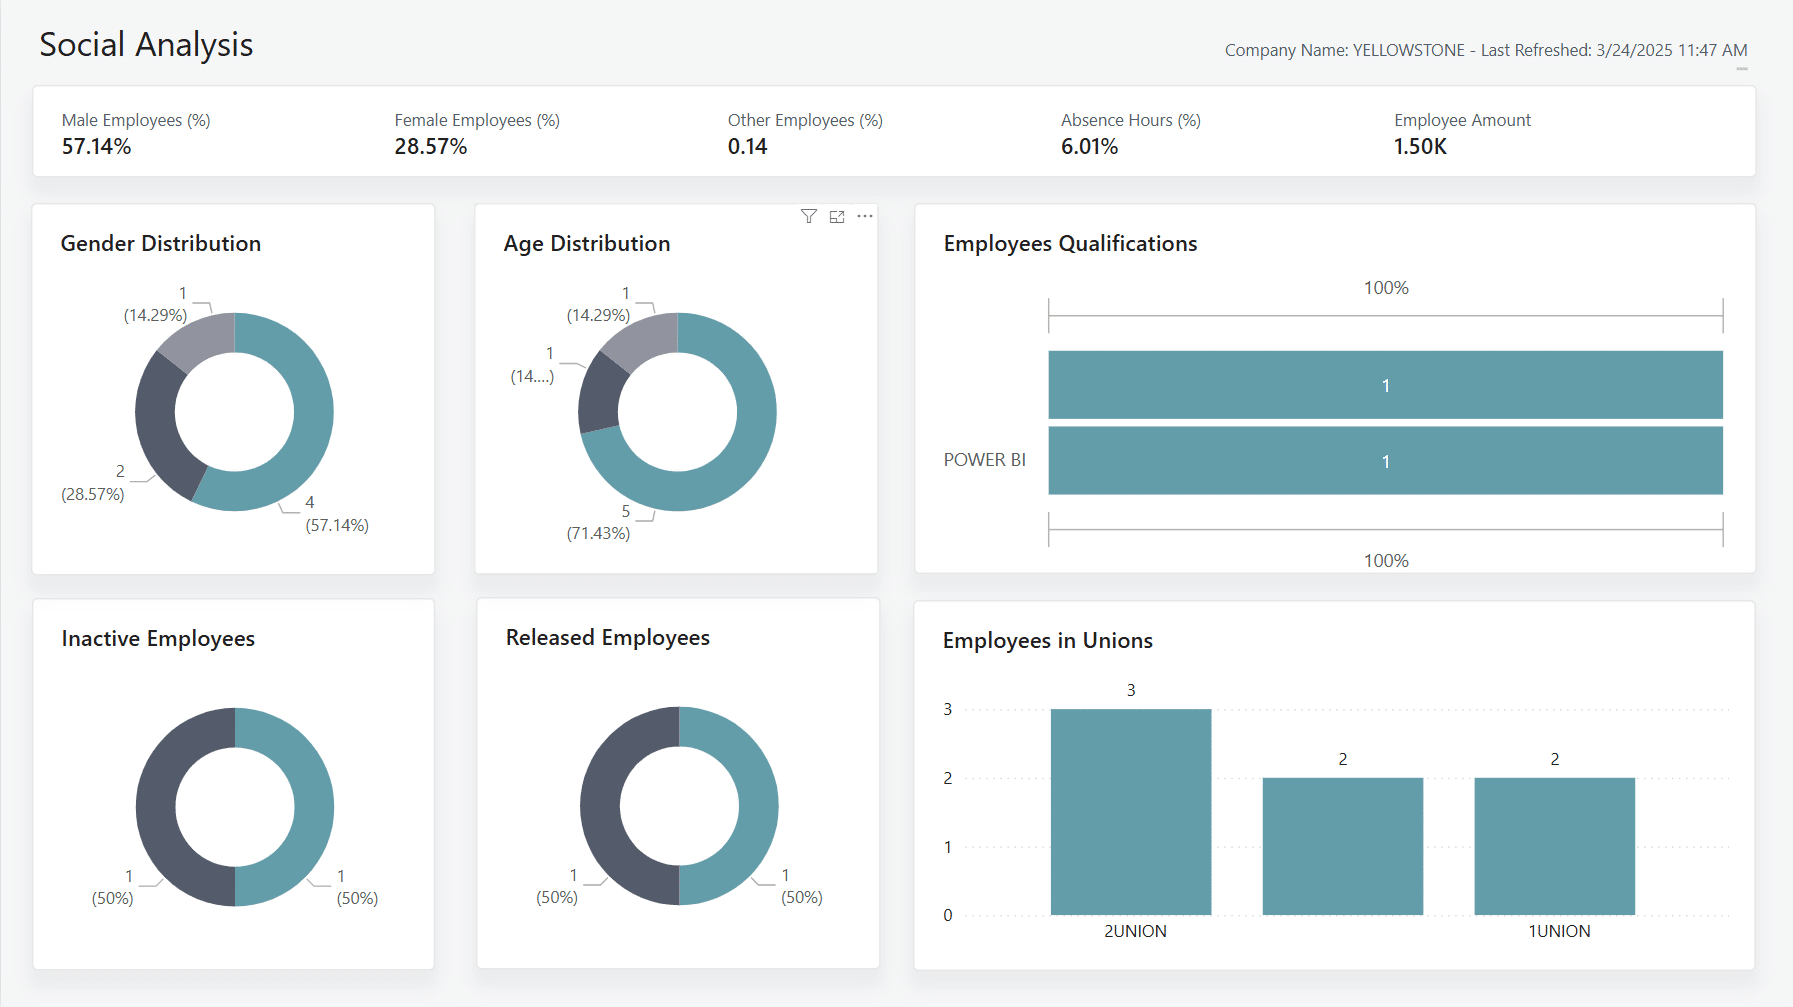
By bringing this level of detail into one place, the Social Analysis report can help your organisations better understand the makeup of teams, identify areas for improvement in diversity or representation, and meet key social reporting obligations in a structured, data-driven way.
Next Steps for Sustainability Reporting
Looking ahead, users will be able to access the new sustainability reports in both Dynamics 365 Business Central and Power BI from June 2025. Released as open-source, these report packs will continue to evolve with input from users and partners. As part of Microsoft’s broader investment in the Sustainability suite, these updates highlight a commitment to delivering practical, adaptable tools that grow with business needs.