The ability to capture data and translate it into a meaningful context is key to organisations’ survival and long-term success. Unfortunately, 70% of organisations believe their data is not used to the fullest and are increasingly struggling to make sense of it. Along the way they are losing important decision-making information.
Microsoft Power BI cloud platform set out to aggregate data inside Microsoft Dynamics 365 Business Central, help perform data modelling and produce improved reports. The platform tries to reach these goals by pulling massive volumes of data from multiple sources and then sorting it your way. Once your data is loaded into Power BI you can build visuals and publish reports. Although Power BI is a powerful tool its ability to optimise data and deliver reports at speed could use some help.
Purpose-built apps accelerate reports and cut costs
If you want to save yourself the pain of lengthy customisation and data modelling to consolidate and analyse reports, you could download a purpose-built App from AppSource. Power BI Gold is one such App. It provides Power BI users better insights based on modelled data and customized reports at warp speed.
New ways to model your data and accelerate customisations
Power BI Gold easy-to-use tools ensure your reports are relevant. Its filtering apps help to easily manage vast volumes of historical data that are mapped into each dataset from Business Central. This filtering feature is particularly useful for organisations sporting a long history of transactional data. Historical data is not always relevant to new reports and decisioning. Larger volumes of data also translate to longer refresh times leading to scalability issues if not managed well. So, by using a simple date range filter for instance, users can ensure the dataset is always relevant and performant.
How to analyse historical data and access insights
If you find yourself struggling to set up reports and get clarity, consider filtering and refining data by dimension values. Implementing tried-and-tested reporting suites and reconciling dimension values with existing reports is a great first step towards optimising data and gaining clarity.
If you download Power BI Gold reporting for instance, you can easily gather data from Business Central and access a better data model. You can use over 100 calculated measures and start slicing and dicing your data by your dimensions.
These tools make it possible for you to create multiple data views in one report compared to standard filtering and reporting from Business Central. Reports can then be customized based on information relevant to your organisation’s specific needs.
Decision-makers can quickly drill down into dimension value results. They can then compare them on a visual, page or the whole report. These options also save time and reduce margins for error compared to collating data manually from Business Central views and reports.
You can also connect Power BI directly to one company and use Power BI Gold dimensions to set up a separate company in Business Central for a number of sub-units or legal entities.
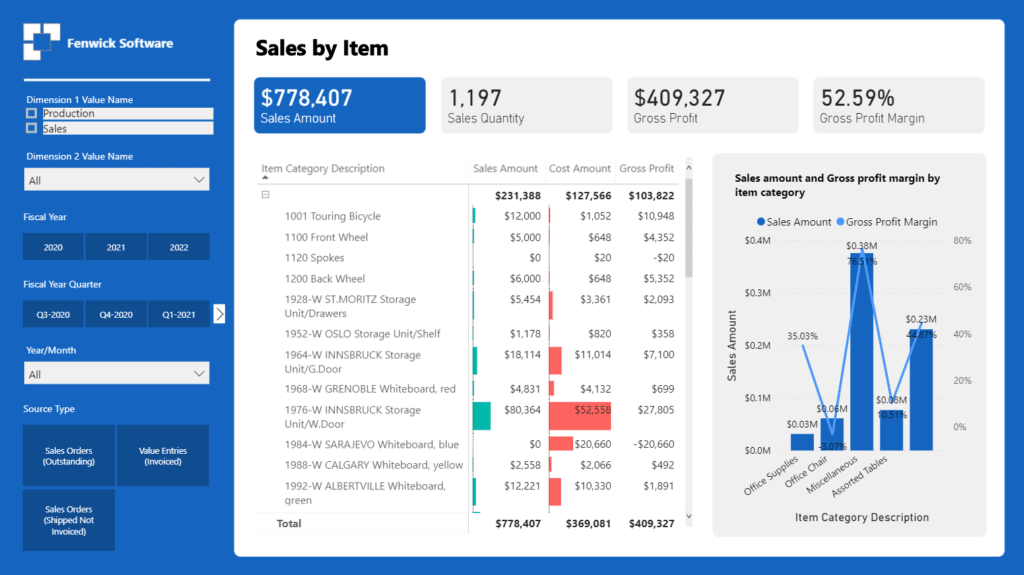
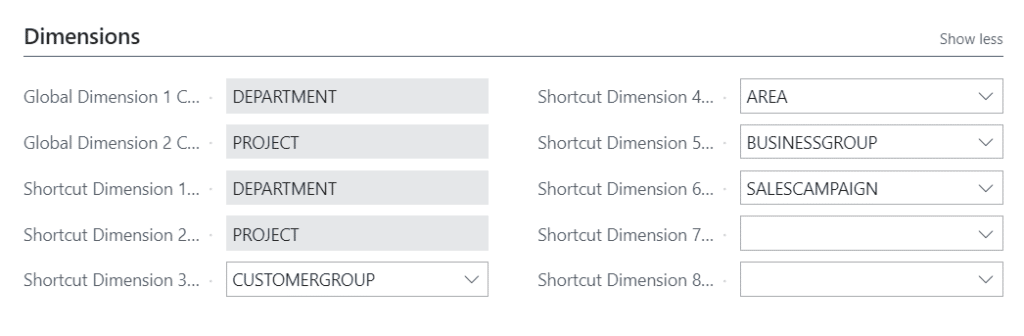
Dimensions in Business Central are ready for use in the Power BI Gold for Sales dataset as seen here in the General Ledger Slide. In this user case Dimension Value 1 is mapped to the department dimension. It can be used as a filter on the Sales by item page to easily slice the dataset by a given department.
Pre-defined datasets optimised for sales, finance, purchasing and inventory
Harnessing complex data sources and greater volumes of data can provide opportunities for optimisation and enhanced insights. However, it can be quite difficult to harness the data and extract meaningful information that actually improves decisioning.
Saving costs and countless development hours trying to build your own.
As an ERP software, Dynamics 365 Business Central features countless tables by standard before more tables can be added for business-specific enhancements.
App packages such as Power BI Gold were purpose-built to provide a far more simple way to report on sales, purchasing, finance, inventory, jobs, and rebates data. The Reports Pack comes with pre-built optimised data models, pre-defined measures to calculate industry-standard KPIs and reports templates.
On a final note
Users can avoid the painful process of designing and running a comprehensive data model by downloading purpose-built Apps.
Power BI Gold seamlessly integrates Business Central and Power BI, enabling clients to easily work with simple-to-use report Apps. Finally, Power BI users can focus on augmented reports that are simply customized to their business needs.
See here sample Gold Power BI Reports packages you can download from AppSource: