
Fenwick Gold Finance for Business Central is a comprehensive business intelligence solution that empowers Business Central finance professionals with powerful insights and visualizations to gain better control and understanding of their financial data.
With interactive dashboards, preconfigured financial data models, and customizable reports tailored to finance-specific metrics, Fenwick Gold Finance for Business Central streamlines your financial reporting.
Key Features and Capabilities
Tailored Financial Reports Ready for Customization
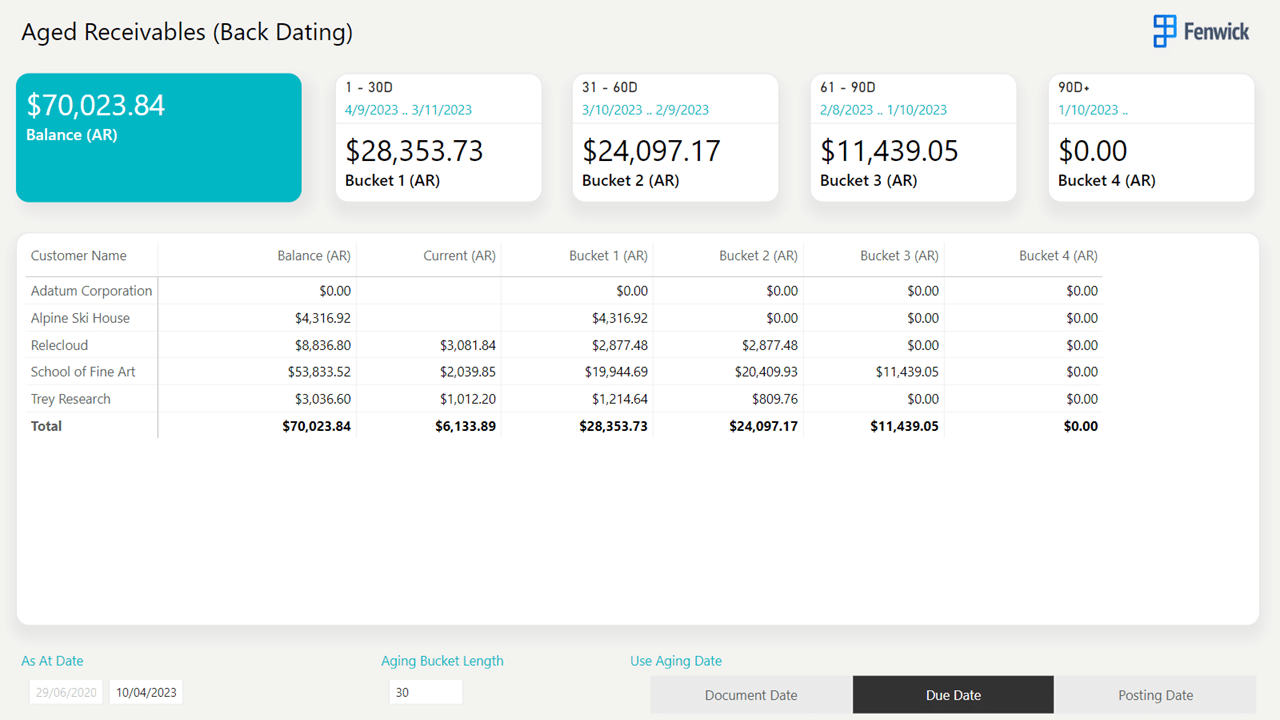
Fenwick Gold Finance for Business Central offers a collection of meticulously crafted financial reports that are ready for customization, allowing you to tailor them to your unique business needs.
From Income Statements and Balance Sheets to Aged Receivables and Payables, we’ve got you covered. With Fenwick Gold Finance for Business Central, you have the flexibility to customize these reports according to your reporting needs. Whether it’s adding additional metrics, adjusting visualizations, or incorporating company-specific branding, you’re in control.
Enhanced Visibility into Financial Performance
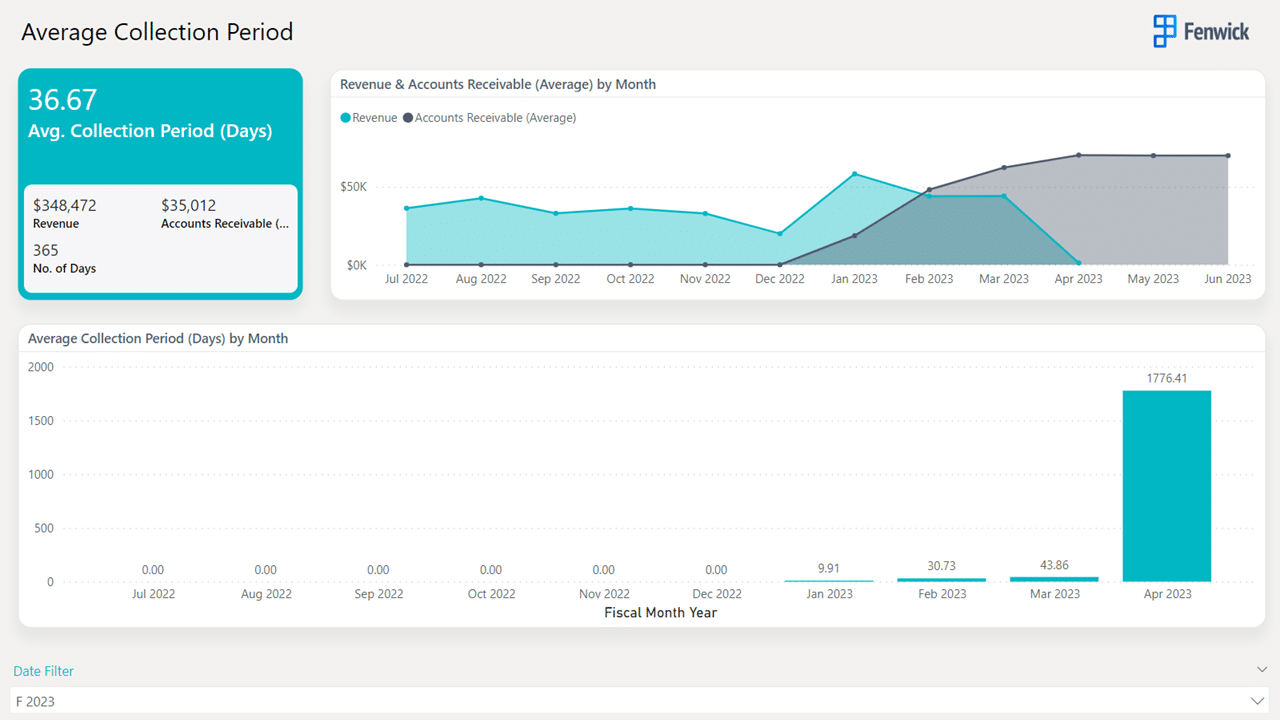
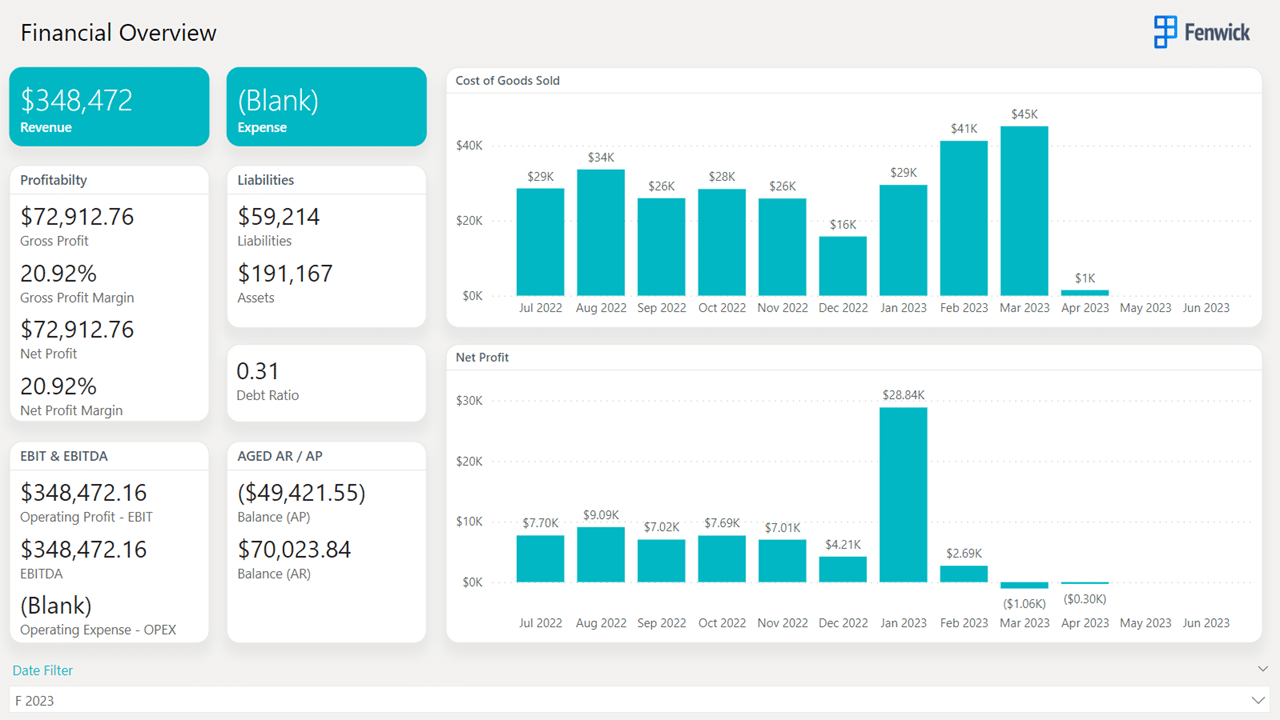
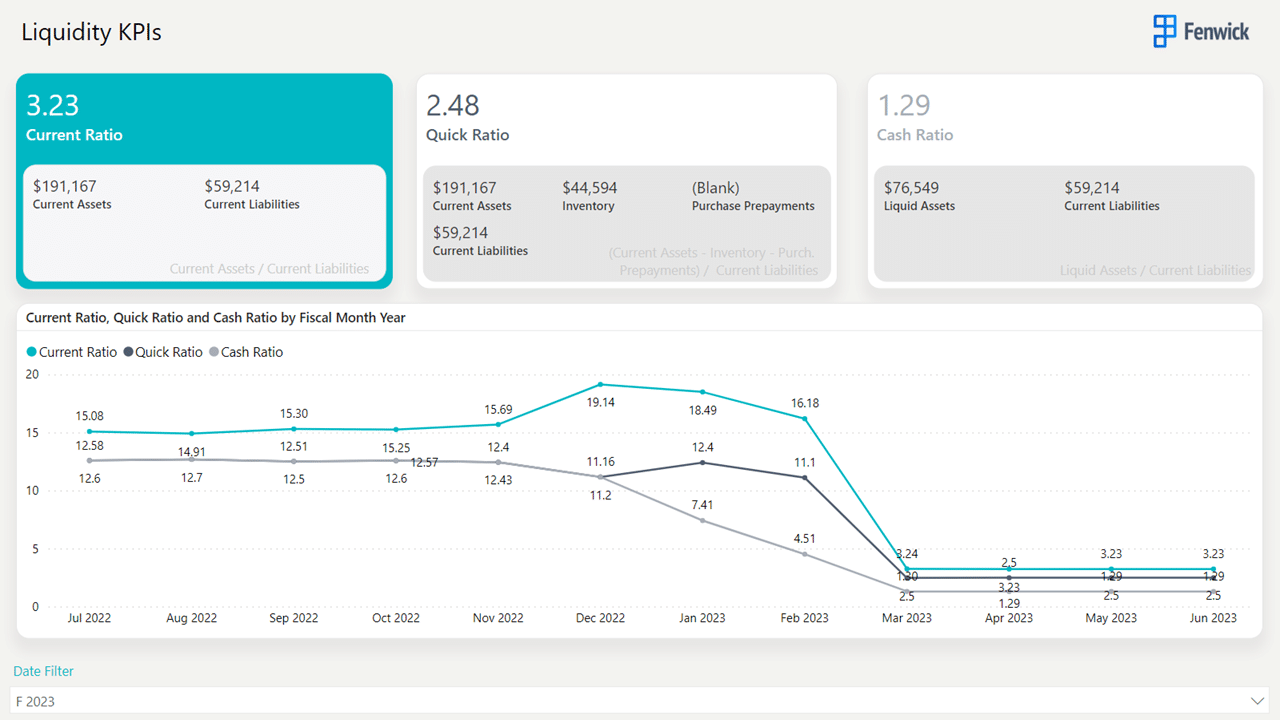
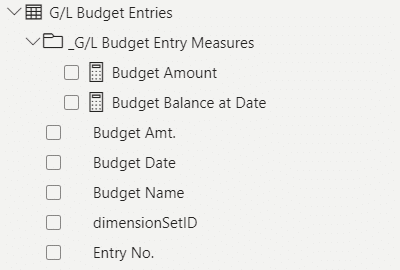
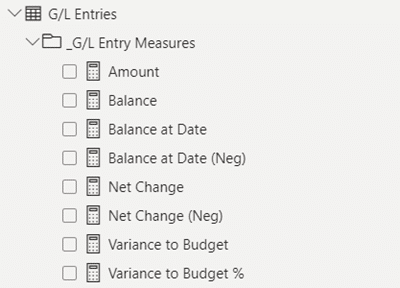
Delve into 200+ Time Intelligence Measures, Financial Performance Metrics & KPIs carefully designed to provide you with deep insights into various aspects of your financial health. From profitability metrics that gauge the effectiveness of your revenue generation to liquidity indicators that assess your short-term financial stability, and activity KPIs that measure the efficiency of your operational processes.
- Cash Ratio
- Current Ratio
- Quick Ratio
- Days Payable Outstanding – DPO
- Days Sales of Inventory – DSI
- Days Sales Outstanding – DSO
- Return On Assets – ROA
- Return On Capital Employed – ROCE
- Return On Equity – ROE
- Return On Net Assets – RONA
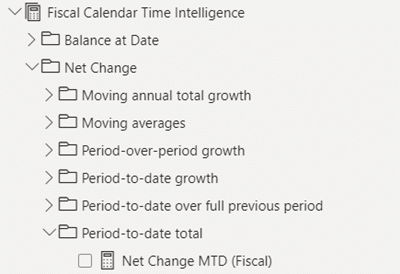
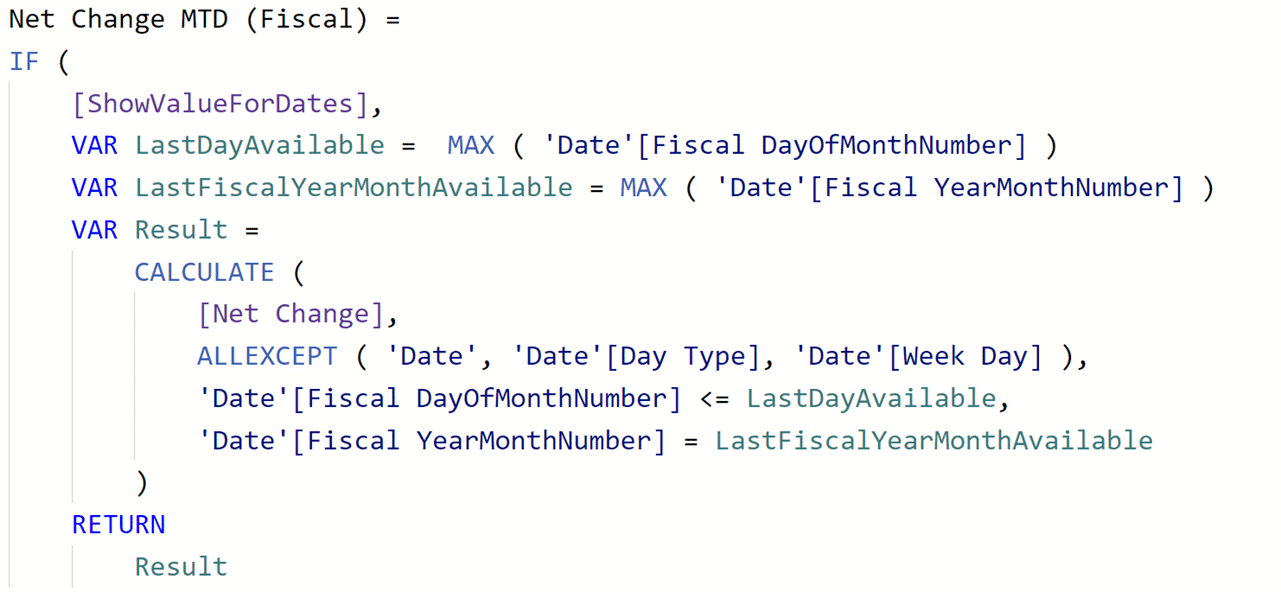
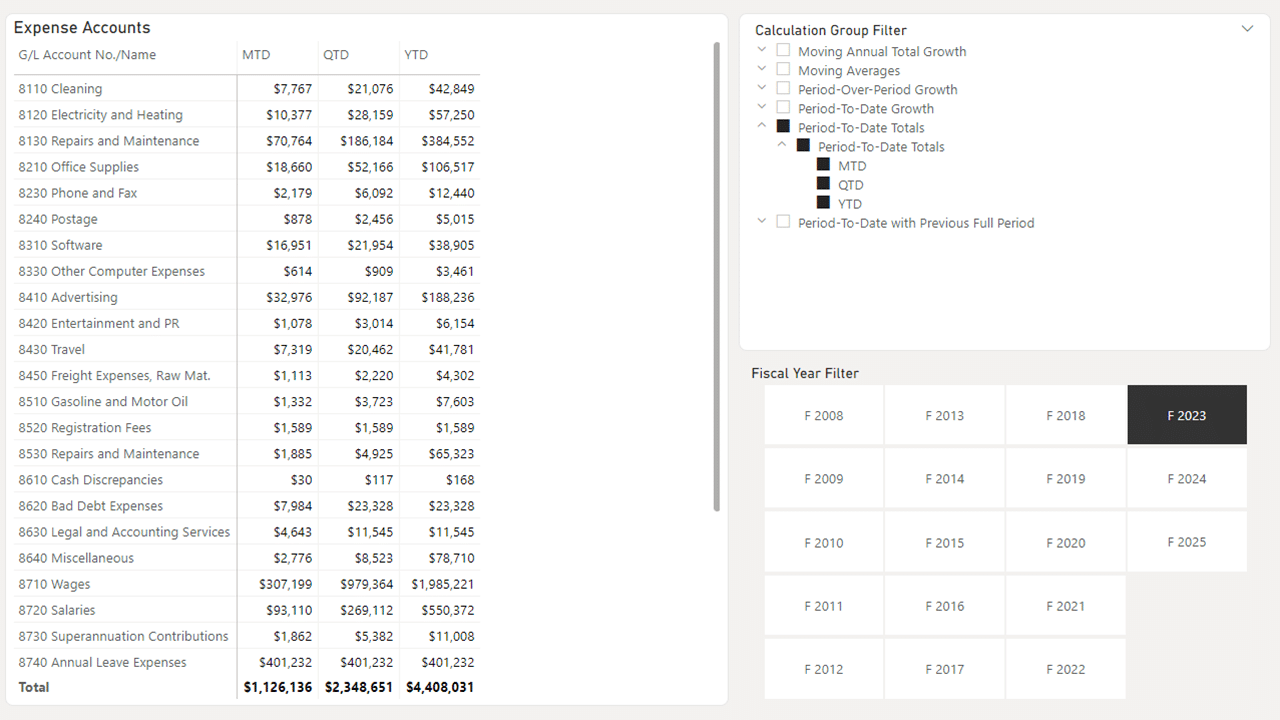
Unlock Reusability and Efficiency with Calculation Groups
Calculation Groups offer a powerful solution for managing calculations in Power BI.
Rather than repeating the same time intelligence calculations for each measure individually, Calculation Groups define them once within a group. Easily apply these calculations to any new or existing measure in Fenwick Gold Finance for Business Central, expanding the reporting capabilities and streamlining your analysis.
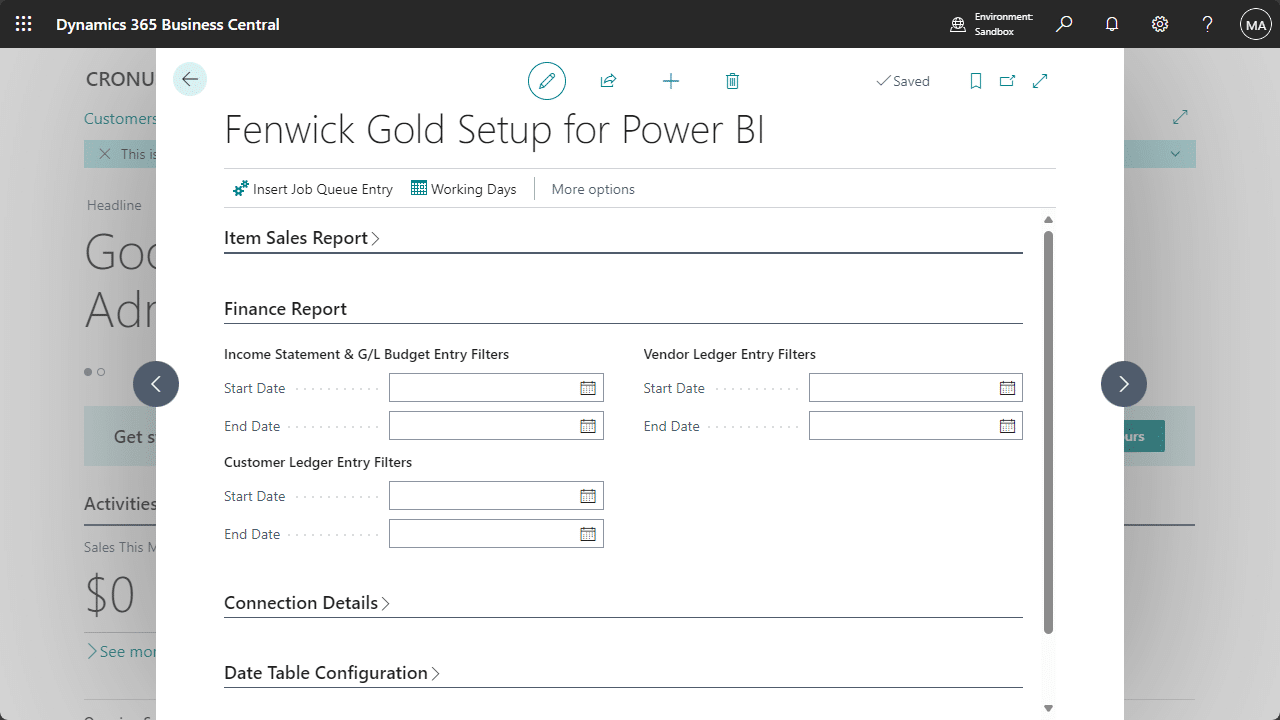
Data Filtering for Advanced Data Management
Gain precise control over the volume of data exposed to your Power BI dataset. By utilizing a comprehensive set of filters in Business Central, you can fine-tune and manage the data that flows into Fenwick Gold Finance for Business Central.
Control your data so that your reports and dashboards load swiftly, ensuring a seamless and responsive experience for users.
Try out Fenwick Gold Finance for Business Central
Fenwick Gold for Power BI
Fenwick Gold for Power BI takes all the hard work out of implementing Power BI reporting. It seamlessly links Business Central data to Power BI out of the box.
With Fenwick Gold for Power BI, you can build reports by any dimension in the Business Central. Measures are ready to go, and the data is already modelled for analysis; instant plug and play for business reporting.
Connector for Business Central
There’s two parts to our solution — the data connector and the Fenwick Gold Finance reports. Make sure you download both to get the most out of Fenwick Gold Finance for Business Central