The Fenwick Gold Finance semantic model includes a large set of predefined measures. These measures have been organized into three main categories:
- Time Intelligence
- Table measures
- Calculation Groups
Time Intelligence Measures
See Time intelligence measures in Fenwick Gold for Business Central
Finance Table Measures
Activity KPIs
| Measure Name | Description |
|---|---|
| Average Collection Period (Days) | The average period in days that it takes for a business to receive payments owed by its customers in terms of accounts receivable. |
| % Change in Revenue | The percent change between Revenue (Balance at Date) and Revenue (Beginning Balance). |
| % Change in Operating Profit – EBIT | The percent change between Operating Profit – EBIT (Balance at Date) and Operating Profit – EBIT (Beginning Balance). |
| Days Sales Outstanding – DSO | Days sales outstanding (DSO) is the average number of days it takes a company to receive payment for a sale. Based on Accounts Receivable, Revenue, and No. of Days. |
| Days Payable Outstanding – DPO | Days payable outstanding (DPO) computes the average number of days a company needs to pay its bills and obligations. Based on Accounts Payable, Cost of Goods Sold and No. of Days. |
| Days Sales of Inventory – DSI | Days sales of inventory (DSI) is the average time in days that a company takes to turn its inventory. Based on Inventory, COGS, and No. of Days. |
| Cash Conversion Cycle – CCC | The cash conversion cycle (CCC) is a metric that expresses the length of time (in days) that it takes for a company to convert its investments in inventory and other resources into cash flows from sales. Based on DSI, DSO, and DPO. |
| Degree Of Operating Leverage – DOL | The degree of operating leverage (DOL) is a multiple that measures how much the operating income of a company will change in response to a change in sales. Based on % Change in Operating Profit, EBIT, and % Change in Revenue. |
| Asset Turnover Ratio | The asset turnover ratio measures the value of a company’s sales or revenues relative to the value of its assets. Based on Revenue and Assets. |
| Inventory Turnover | Inventory turnover is a financial ratio showing how many times a company turned over its inventory relative to its cost of goods sold in a given period. Based on COGS and Inventory (Average). |
Balance Sheet Measures
Assets
| Measure Name | Description |
|---|---|
| Current Assets | The Balance at Date for all accounts categorized by the Current Assets (Level 2 Category) parameter. |
| Inventory | The Balance at Date for all accounts categorized by the Inventory (Level 3 Category) parameter. |
| Working Capital | The difference between Current Assets and Current Liabilities. |
| Assets | The Balance at Date for all accounts categorized by the Assets (Level 1 Category) parameter. |
| Accounts Receivable | The Balance at Date for all accounts categorized by the Account Receivable (Level 3 Category) parameter. |
| Accounts Receivable (Beginning Balance) | Specifies the balance of accounts receivable as of a specific date. |
| Accounts Receivable (Average) | The average value of the accounts receivable account between the beginning balance and the current balance. Based on Accounts Receivable (Beginning Balance) and Accounts Receivable. |
| Inventory (Beginning Balance) | Specifies the balance of Inventory as of a specific date. |
| Inventory (Average) | The average value of the inventory between the beginning balance and the current balance. Based on Inventory (Beginning Balance) and Inventory. |
| Purchase Prepayments | The Balance at Date for all accounts categorized by the Purchase Prepayments (Level 3 Category) parameter. |
| Liquid Assets | The Balance at Date for all accounts categorized by the Liquid Assets (Level 3 Category) parameter. |
| Fixed Assets | The Balance at Date for all accounts categorized by the Fixed Assets (Level 2 Category) parameter. |
| Capital Employed | The difference between Assets and Current Liabilities. |
Liabilities
| Measure Name | Description |
|---|---|
| Current Liabilities | The Balance at Date for all accounts categorized by the Current Liabilities (Level 2 Category) parameter. |
| Liabilities | The Balance at Date for all accounts categorized by the Liabilities (Level 1 Category) parameter. |
| Liabilities & Equity | The sum of Liabilities and Equity |
| Accounts Payable | The Balance at Date for all accounts categorized by the Accounts Payable (Level 3 Category) parameter. |
| Liabilities (Neg) | The opposite signed value for the Balance at Date for all accounts categorized by the Liabilities (Level 1 Category) parameter. |
| Accounts Payable (Neg) | The opposite signed value for the Balance at Date for all accounts categorized by the Accounts Payable (Level 3 Category) parameter. |
| Payroll Liabilities | The Balance at Date for all accounts categorized by the Payroll Liabilities (Level 2 Category) parameter. |
| Long term Liabilities | The Balance at Date for all accounts categorized by the Longterm Liabilities (Level 2 Category) parameter. |
Equity
| Measure Name | Description |
|---|---|
| Shareholder’s Equity | The Balance at Date for all accounts categorized by the Shareholders’ Equity (Level 2 Category) parameter. |
| Equity | The Balance at Date for all accounts categorized by the Equity (Level 1 Category) parameter. |
Income Statement Measures
Income
| Measure Name | Description |
|---|---|
| Revenue | The Net Change for all accounts categorized by the Revenue (Level 1 Category) parameter. |
| Revenue (Balance at Date) | The Balance at Date for all accounts categorized by the Revenue (Level 1 Category) parameter. |
| Revenue (Beginning Balance) | Specifies the balance as of a specific date for all accounts categorized by the Revenue (Level 1 Category) parameter. |
| Interest Revenue | The Net Change for all accounts categorized by the Interest Revenue (Level 2 Category) parameter. |
| FX Gains Revenue | The Net Change for all accounts categorized by the FX Gains Revenue (Level 2 Category) parameter. |
| Extraordinary Revenue | The Net Change for all accounts categorized by the Extraordinary Revenue (Level 2 Category) parameter. |
| Operating Revenue | Revenue + Interest Revenue + FX Gains Revenue + Extraordinary Revenue |
| Interest Revenue (Balance at Date) | The Balance at Date for all accounts categorized by the Interest Revenue (Level 2 Category) parameter. |
| Interest Revenue (Beginning Balance) | Specifies the balance as of a specific date for all accounts categorized by the Interest Revenue (Level 2 Category) parameter. |
| FX Gains Revenue (Balance at Date) | The Balance at Date for all accounts categorized by the FX Gains Revenue (Level 2 Category) parameter. |
| FX Gains Revenue (Beginning Balance) | Specifies the balance of FX Gains Revenue as of a specific date. |
| Extraordinary Revenue (Balance at Date) | The Balance at Date for all accounts categorized by the Extraordinary Revenue (Level 2 Category) parameter. |
| Extraordinary Revenue (Beginning Balance) | Specifies the balance for all accounts categorized by the Extraordinary Revenue (Level 2 Category) parameter at a specific date. |
| Operating Revenue (Balance at Date) | The Operating Revenue Balance at Date. |
| Operating Revenue (Beginning Balance) | Specifies the Operating Revenue balance at a specific date. |
Cost of Goods Sold (COGS)
| Measure Name | Description |
|---|---|
| Cost of Goods Sold | The Net Change for all accounts that are categorized by the Cost of Goods Sold (Level 1 Category). |
Expense
| Measure Name | Description |
|---|---|
| Expense | The Net Change amount for all accounts that are categorized by Expense (Level 1 Category). |
| Interest Expense | The Net Change amount for all accounts that are categorized by Interest Expense (Level 2 Category). |
| Tax Expense | The Net Change amount for all accounts that are categorized by Tax Expense (Level 2 Category). |
| Extraordinary Expense | The Net Change amount for all accounts that are categorized by Extraordinary Expense (Level 2 Category). |
| Operating Expense – OPEX | The Operating Expense is the Expense without Interest Expense, FX Lossess Expense, Tax expense and Extraordinary Expense. |
| Purchases | The Net Change amount for all accounts that are categorized by Purchase (Level 3 Category). |
| FX Losses Expense | The Net Change amount for all accounts that are categorized by FX Lossess Exoebse (Level 2 Category). |
| Depreciation and Amortization | The Net Change amount for all accounts that are categorized by Depreciation and Amortization Expense (Level 2 Category). |
| Expense (Balance at Date) | The Balance at Date for all accounts categorized by the Expense (Level 1 Category) parameter. |
| Expense (Beginning Balance) | Specifies the balance for all accounts categorized by the Expense (Level 1 Category) parameter at a specific date. |
| Interest Expense (Balance at Date) | The Balance at Date for all accounts categorized by the Interest Expense (Level 2 Category) parameter. |
| Interest Expense (Beginning Balance) | Specifies the balance for all accounts categorized by the Interest Expense (Level 2 Category) parameter at a specific date. |
| FX Losses Expense (Balance at Date) | The Balance at Date for all accounts categorized by the FX Losses Expense (Level 2 Category) parameter. |
| FX Losses Expense (Beginning Balance) | Specifies the balance for all accounts categorized by the FX Losses Expense (Level 2 Category) parameter at a specific date. |
| Tax Expense (Balance at Date) | The Balance at Date for all accounts categorized by the Tax Expense (Level 2 Category) parameter. |
| Tax Expense (Beginning Balance) | Specifies the balance for all accounts categorized by the Tax Expense (Level 2 Category) parameter at a specific date. |
| Extraordinary Expense (Balance at Date) | The Balance at Date for all accounts categorized by the Extraordinary Expense (Level 2 Category) parameter. |
| Extraordinary Expense (Beginning Balance) | Specifies the balance for all accounts categorized by the Extraordinary Expense (Level 2 Category) parameter at a specific date. |
| Operating Expense – OPEX (Balance at Date) | The Operating Expense Balance at Date. |
| Operating Expense – OPEX (Beginning Balance) | Specifies the Operating Expense at a specific date. |
Liquidity KPIs
| Measure Name | Description |
|---|---|
| Current Ratio | Assesses the relationship between a company’s current assets and its current liabilities. Calculated by dividing Current Assets by Current Liabilities. |
| Quick Ratio | Evaluates a company’s ability to settle its current liabilities without relying on inventory sales or external funding. Calculated by dividing the result of (Current Assets – Inventory) – Purchase Prepayments by Current Liabilities. |
| Cash Ratio | Assesses a company’s ability to meet current liabilities with cash on hand. Calculated by dividing the Liquid Assets by the Current Liabilities. |
Profitability KPIs
| Measure Name | Description |
|---|---|
| Gross Profit Margin | A quantitative measure, calculated by deducting the Cost of Goods Sold (COGS) from Net Sales. |
| Net Profit Margin | Quantifies the proportion of Net Income generated in relation to the Revenues Received by a company. |
| Gross Profit | Calculated by subtracting Cost of Goods Sold from Revenue. |
| Net Profit | Calculated by subtracting Costs of Goods Sold and Expenses from Revenue. |
| Operating Profit – EBIT (Beginning Balance) | The Balance at Date Operating Profit minus the Balance at Date Operating Expense. |
| Operating Profit – EBIT | Calculated by subtracting the Operating Expense from the Operating Revenue. |
| Operating Profit – EBIT (Balance at Date) | Specifies the Operating Profit – EBIT at a specific date. |
| Operating Profit Margin | The Operating Profit Margin is calculated by dividing the Operating Profit – EBIT by the Operating Revenue. |
| EBITDA | A commonly employed metric to assess the fundamental profitability of a company, disregarding interest, taxes, Depreciation, and Amortization. Calculated by adding Depreciation and Amortization |
| Return on Assets – ROA | Calculated by dividing Net Profit by the Assets. |
| Return on Equity – ROE | Calculated by dividing Net Profit by the Shareholders’ Equity. |
| Return on Net Assets – RONA | Calculated by dividing Net Profit by the Fixed Assets + Working Capital. |
| Return on Capital Employed – ROCE | Calculated by dividing the Operating Profit – EBIT by Capital Employed. |
| Debt/Equity Ratio | A metric that evaluates a company’s dependence on debt by comparing its total liabilities to shareholder equity. Calcualted by dividing the Liabilities by the Shareholder’s Equity. |
| Shareholder Equity Ratio | The Shareholder Equity ratio illustrates the portion of a company’s assets financed through stock issuance rather than borrowing funds. Calculated by dividing the Shareholders’ Equity by the Assets. |
| Debt Ratio | The debt ratio measures a company’s leverage by comparing its total debt to total assets. Calculated by dividing the Liabilities by the Assets. |
Aging Bucket Period
The aging bucket period fields are used in both Aged Receivables (Back Dating) and Aged Payables (Back Dating) reports. They specify meta data about the four periods in relation to the chosen Aging Bucket Length and As At Date.
| Measure Name | Description |
|---|---|
| Bucket 1 Date Range | Specifies the date range for Bucket 1. |
| Bucket 1 Range | Specifies the range in days for Bucket 1. |
| Bucket 2 Date Range | Specifies the date range for Bucket 2. |
| Bucket 2 Range | Specifies the range in days for Bucket 2. |
| Bucket 3 Date Range | Specifies the date range for Bucket 3. |
| Bucket 3 Range | Specifies the range in days for Bucket 3. |
| Bucket 4 Date Range | Specifies the date range for Bucket 4. |
| Bucket 4 Range | Specifies the range in days for Bucket 4. |
Customer Ledger Measures
| Measure Name | Description |
|---|---|
| Bucket 1 (AR) | Specifies the Amount Receivable for bucket 1. |
| Bucket 2 (AR) | Specifies the Amount Receivable for bucket 2. |
| Bucket 3 (AR) | Specifies the Amount Receivable for bucket 3. |
| Bucket 4 (AR) | Specifies the Amount Receivable for bucket 4. |
| Current | Specifies the Amount Receivable where the date is greater than or equal to the last date specified in the As At Date filter. |
| Amount Receivable (LCY) | Sum of Amount (LCY) from the Customer Ledger Entry table. |
| Balance (AR) | Specifies the Aged Receivable balance. |
| Original Amount (LCY) | Sum of Amount (LCY) from the Customer Ledger Entry table where entry type is initial entry. |
G/L Budget Entry Measures
| Measure Name | Description |
|---|---|
| Budget Amount | Sum of Budget Amount from the Budget Entries table. |
G/L Entry Measures
| Measure Name | Description |
|---|---|
| Amount | The sum of the Amount field from the G/L Entries table. |
| Balance | The sum of the Amount field from the G/L Entries table removing any applied date filter. Generally used to specify the balance of a general ledger account. |
| Balance at Date | Specifies the G/L account balance on the last date included in the Date Filter field. |
| Net Change | Sum of the Amount field from the G/L Entries table excluding any closing income statement entries. Specifies the net change in the account balance during the time period in the Date Filter field. |
| Net Change (Neg) | Reversed sign version of Net Change. |
| Variance to Budget | Difference between Net Change and Budget Amount. |
| Variance to Budget % | Quotient of Variance to Budget and Net Change represented as a percentage. |
Vendor Ledger Measures
| Measure Name | Description |
|---|---|
| Bucket 1 (AP) | Specifies the Amount Payable for bucket 1. |
| Bucket 2 (AP) | Specifies the Amount Payable for bucket 2. |
| Bucket 3 (AP) | Specifies the Amount Payable for bucket 3. |
| Bucket 4 (AP) | Specifies the Amount Payable for bucket 4. |
| Current (AP) | Specifies the Amount Payable where the date is greater than or equal to the last date specified in the As At Date filter. |
| Amount Payable (LCY) | The sum of Amount (LCY) from the Vendor Ledger Entry table. |
| Balance (AP) | Specifies the Aged Payable balance. |
| Original Amount | The sum of Amount (LCY) from the Vendor Ledger Entry table where entry type is initial entry. |
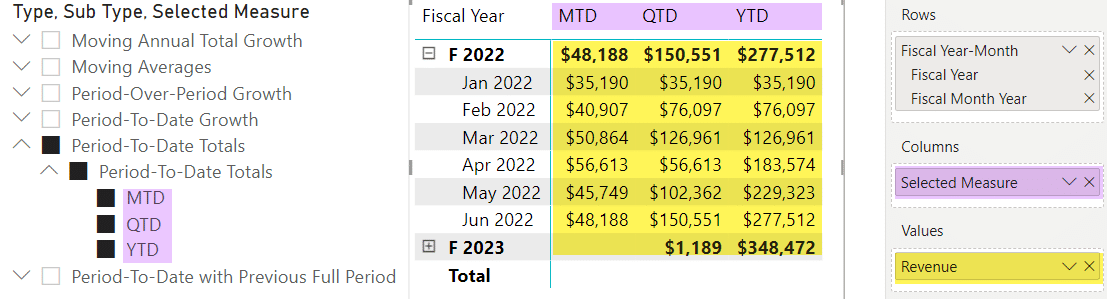
Calculation Group Measures
Calculation groups allow users to apply reusable groups of calculations to different measures. They work by defining a base calculation with a common formula and creating multiple calculation items that modify the base calculation with different parameters. Fenwick Gold for Power BI uses this feature to provide time intelligence for any of the available measures in the dataset.
An example of this is shown below. The columns of the matrix display the Selected Measure, which is selected by the filter on the left. The values of the matrix display the Revenue measure which is passed through to the selected measure as the parameter.
This functionality allows you to quickly apply different Selected Measures to the parameter value.
NOTE: There are three variations of the time intelligence calculation groups. These variations coincide with the three calendar types in the dataset. Please ensure that you use the Calc. Group - Time Intelligence with its corresponding calendar.
Calc. Group – Time Intelligence for Calendar (…)
| Field Name | Description |
|---|---|
| Type | The parent grouping of the calculation group |
| Sub Type | The child grouping of the calculation group |
| Selected Measure | The individual time intelligence measure selected for reporting |
| Calc. Group Hierarchy | A hierarchy of Type > Sub Type > Selected Measure |