

Power BI Gold takes all the hard work out of implementing Power BI for reporting from a Microsoft Dynamics NAV database. It consists of individual report packs, each relating to a specific module in NAV with its own unique set of standard visuals and datasets.
In this installment post I’m going to explore the Power BI Gold for Purchasing Report pack in more detail.
The Item Purchases Report categorises purchasing into three key areas: outstanding purchase orders, received not invoiced purchase orders, and purchase value entries (posted).
Within this, you can further categorise reporting by date (e.g. month, year, quarter, previous year) as well as by Item, Location, Vendor, Purchaser and NAV Dimensions 1 through 8.
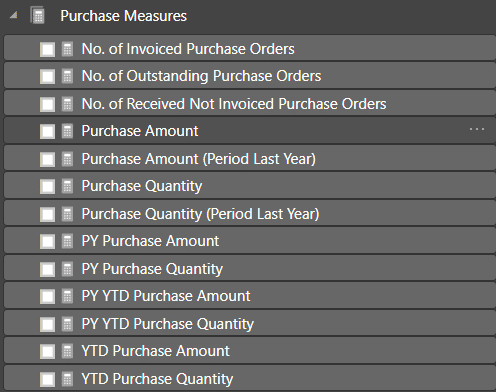
Power BI Gold for Purchasing comes with these standard measures used throughout the report that can be interacted with and filtered down by any of the areas mentioned above.
As with all Power BI Gold report packs we’ve built a standard set of visuals to get you started. These include, Purchases by Item, Purchases by Purchaser, and Purchases by Vendor pages, for example. You also have the ability to drill down on these key reporting areas to view more detailed information such as what item was purchased, the quantity for that specific transaction, and the date it was purchased.
Users can also use the dataset within the report to generate their own visuals. This gives them the ability to easily interact with their data.
If you’d like to experience how Power BI can improve the way you consume data from NAV, we can help you.